Targeting Guide
Targeting is a set of visual and exploratory tools for identifying future demand flexibility potential. Customers can use Targeting to understand patterns of energy use in their service territory, identify customers with the greatest propensity to save energy, and target enrollment in demand-side programs. Customer Lookup provides direct access to individual location-level information, providing a deeper exploration of targeting outcomes.
Targeting Workflow
The Targeting workflow allows users to build customer cohorts that deliver higher returns in program participation. The Targeting workflow contains 4 key steps:
- Select Customer Filters
- Select Interventions or Advanced Features
- Review Impacts between targeted and non-targeted populations
- Export Results
-
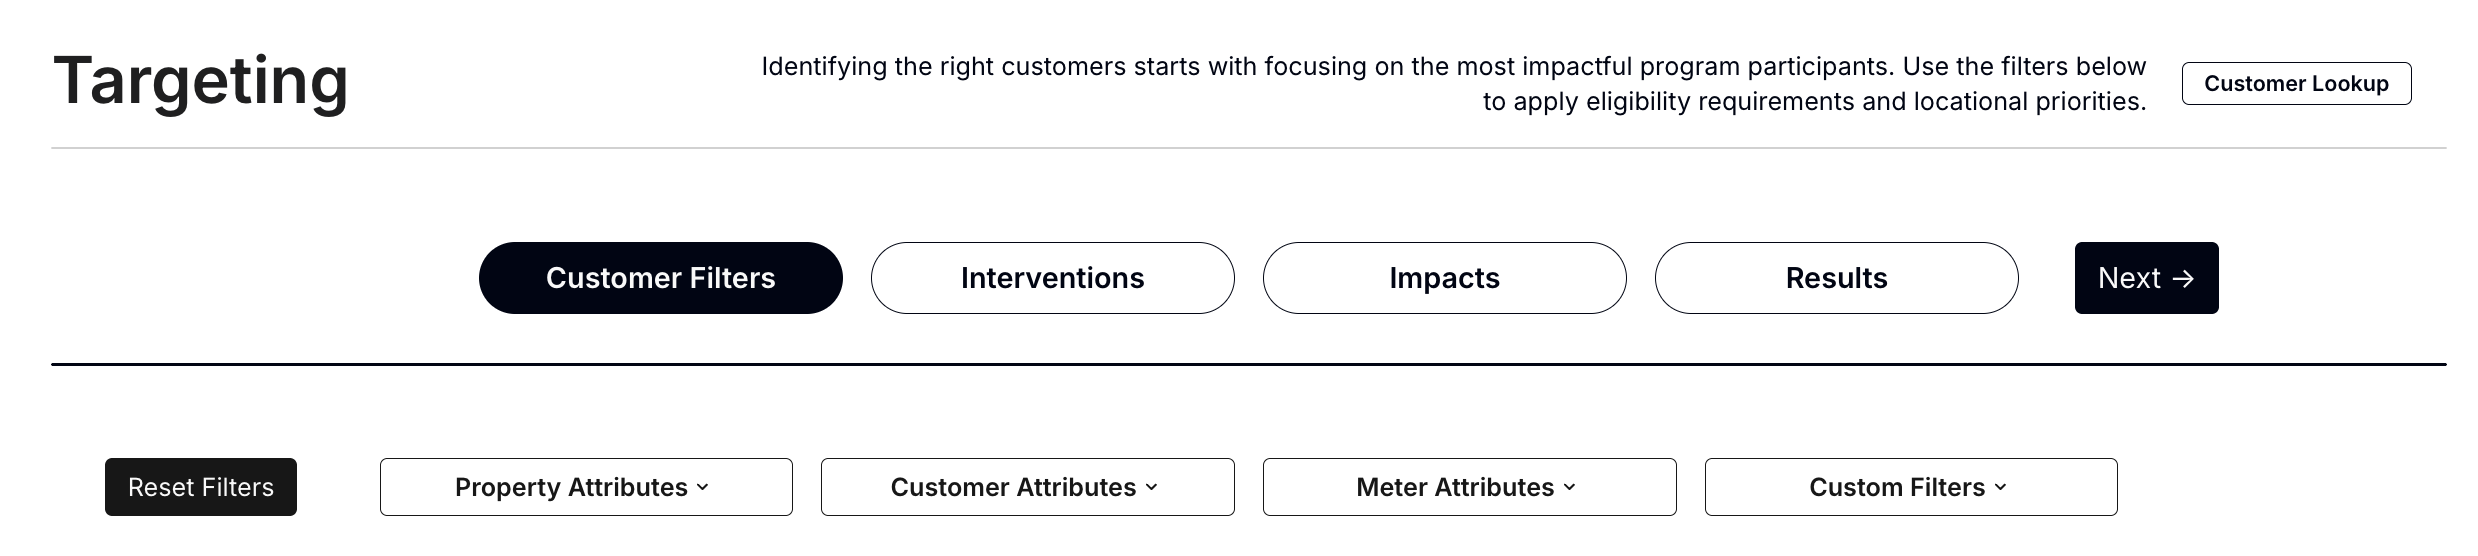
Select Customer Filters
In this step, users can identify the most impactful customers in the total population by applying program eligibility requirements, locational or equity priorities, or focuses that drive program and portfolio goals. For example, a program administrator may wish to investigate the opportunity for a low-income residential program, and would therefore begin by targeting specific locations using the Residential and Low-Income filters. Other filtering options include (but are not limited to):
- Property Attributes:
- City
- Climate Zone
- Zip Code
- Only Including Locations with matched Electricity and Gas Meters
- Customer Attributes:
- Sector (Residential, Commercial, Agricultural, etc.)
- Low/Medium Income status
- Building/Business Type
- Single vs. Multifamily selection for Residential
- NAICS group (e.g. office, schools, retail) for Commercial
- Meter Attributes:
- Electric Tariff Rate Code
- Gas Tariff Rate Code
- Net Metering (i.e. solar) customers
- Include/Exclude Meters With Poor Model Fit
- Custom Filters:
- Reach out to your Recurve representative to discuss options
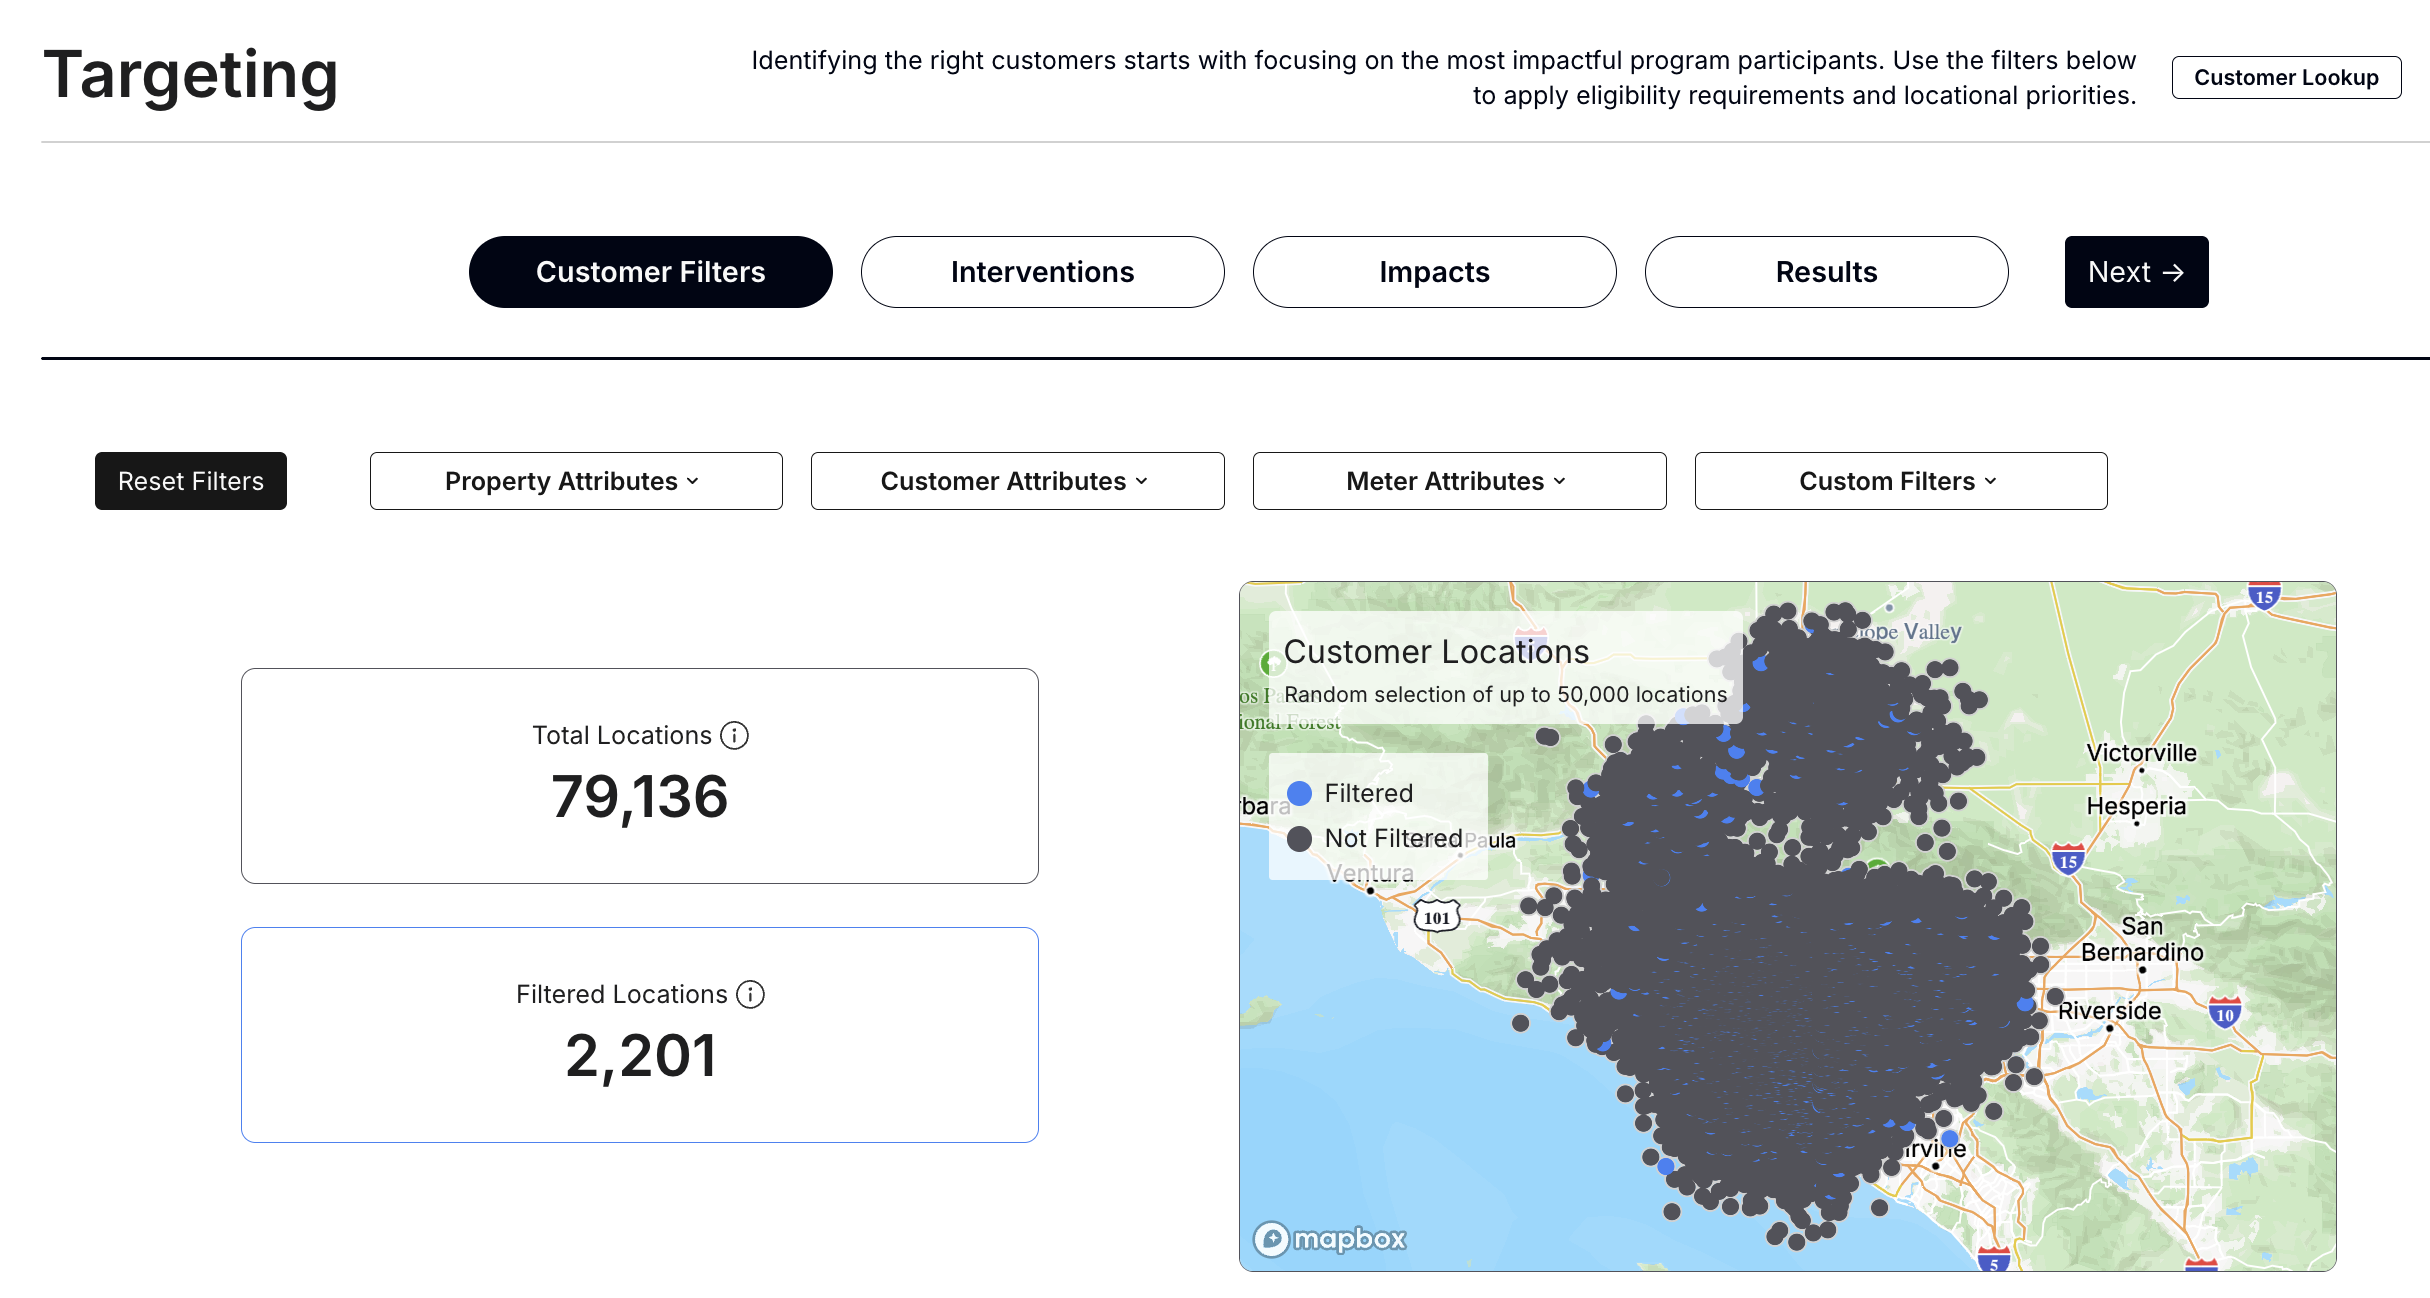
Note: Counts within filters are based on meters and will vary from location counts.
The Total Locations and Filtered Locations are color-coded in the Customer Locations map. Once the user is satisfied with the initial population selection, they may proceed to the following step by hitting “Next” or “Interventions” to identify the highest-potential customers based on energy usage characteristics.
-
Select Interventions
After identifying a set of filtered locations, energy usage characteristics are used to identify customers who will benefit or contribute the most for a given program, using the Intervention Types.
Targeting offers pre-set Intervention Types to target customers who will drive the largest impact for each intervention type, based on each location’s energy-use characteristics. These pre-sets can be used to identify locations that would be most suitable for a specific measure and/or program goal. These presets are suggested starting points that should be refined for specific programs, and users can build fully customized targeting parameter selections by using the Advanced features.
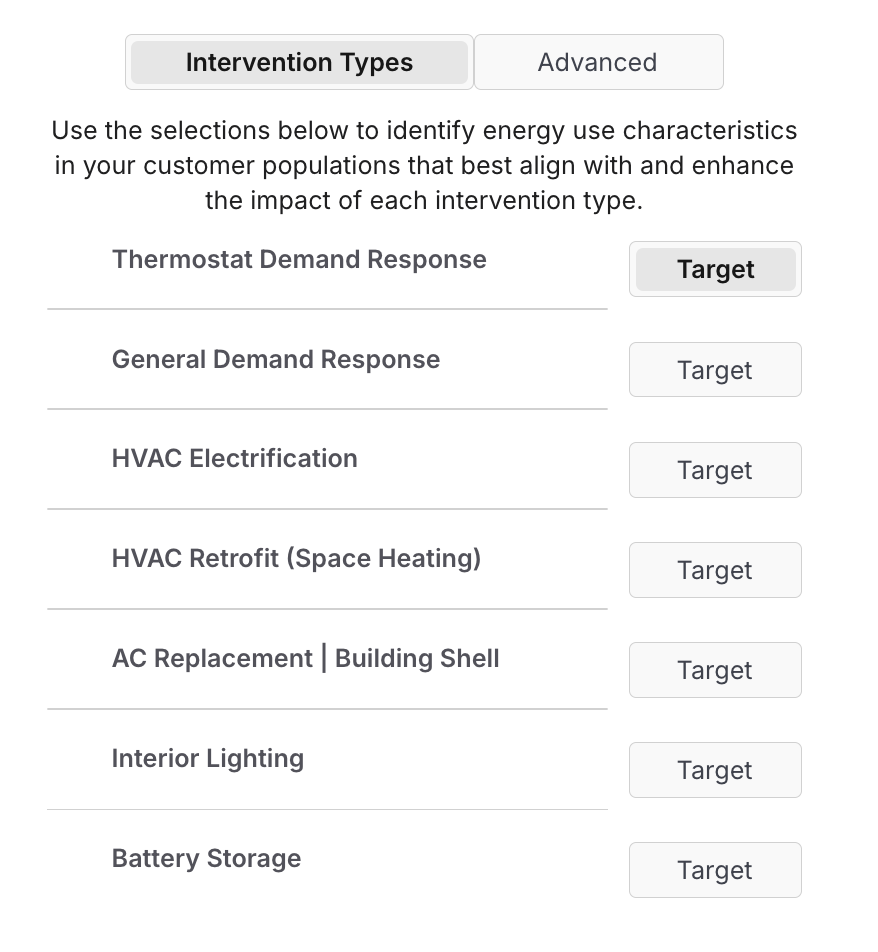
- Ex) Thermostat Demand Response
- E.g., Smart Thermostat program to reduce summer peak loads
- Feature 1: Summer Peak MWh Usage - Top Quartile
- Feature 2: Cooling/Annual (%) - Top Quartile
The Advanced tab allows user to customize these filter selections or adopt additional characteristics to achieve their outcomes. Targeting features are calculated using FLEX Programs’ data science methodologies to peer into energy use characteristics behind the meter. These Advanced Features characterize the magnitude and timing of electricity and gas consumption at every meter, including (but not limited to):
- Cooling MWh Usage - Total annual electric cooling energy
- Heating MWh Usage - Total annual electric heating energy
- Heating Therms Usage - Total annual fossil gas heating energy
- Cooling/Annual (%) - Percentage of customers’ total annual usage attributable to cooling
- Summer Peak/Annual (%) - The percentage of a customer's annual usage that occurred during summer peak periods
- Summer Evening Ramp (kWh) - The difference in a customer's average hourly usage during hour 18 (6 - 7 pm) compared to hour 14 (2 - 3 pm), averaged across the year
- Winter Morning / Winter (%) - The percentage of a customer's annual usage that occurred during winter morning periods. By default, winter morning hours are 8 am to 12 pm in November, December, January, and February
- Baseload MWh Usage - Total annual electricity usage by "always on" loads, e.g,. refrigeration or plug load devices
- Discretionary MWh Usage - Total annual electricity usage from variable loads not driven by hot or cold weather, e.g., interior lighting
- etc.
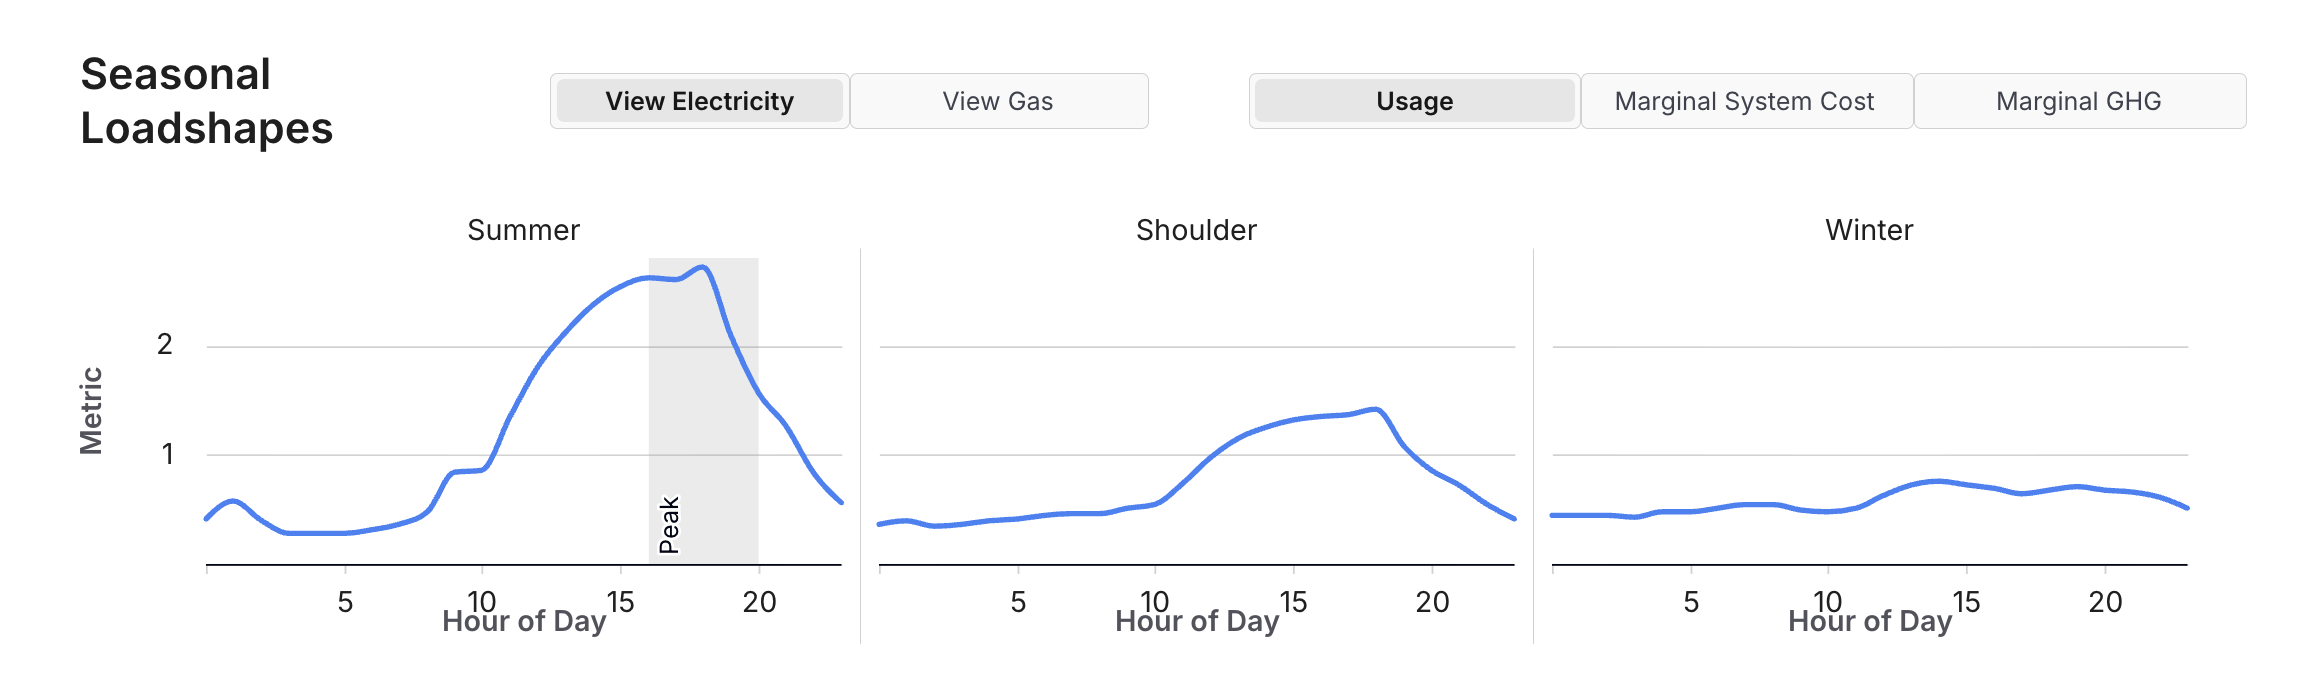
The image below illustrates the outcomes of applying the ‘Thermostat Demand Response’ Intervention Type pre-set - in this example, the customers that fall within the top quartiles of both Summer Peak MWh Usage and Cooling/Annual (%), would be well-suited for a Smart Thermostat program that aims to reduce summer peak loads.
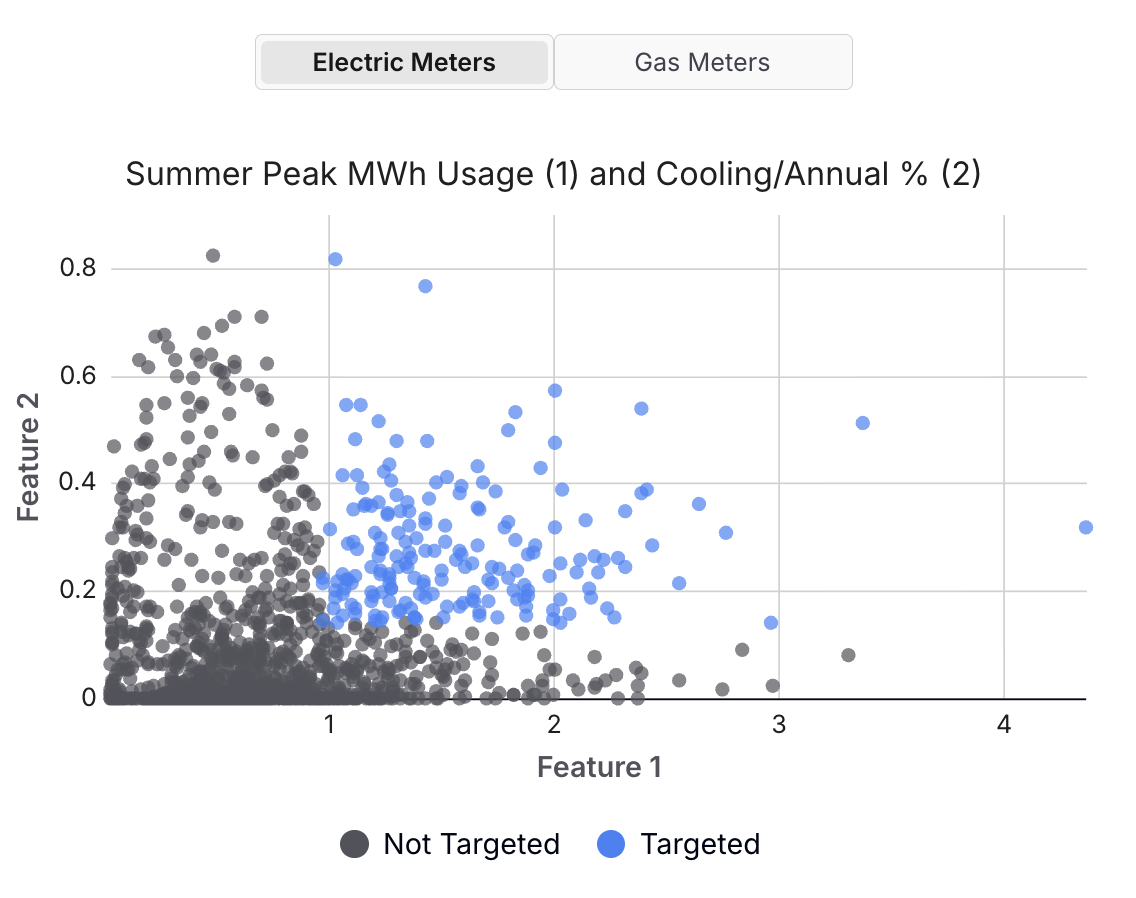
Narrow or widen the cutoffs for the selected targeting parameter to reduce or increase the number of targeted customers (based on the program budget and/or energy savings goals). See more information here: Feature Definitions and Preset Definitions. See here for an example of how major utilities are already using Recurve’s Targeting Parameters to improve program design and streamline recruitment.
-
Reviewing Impacts
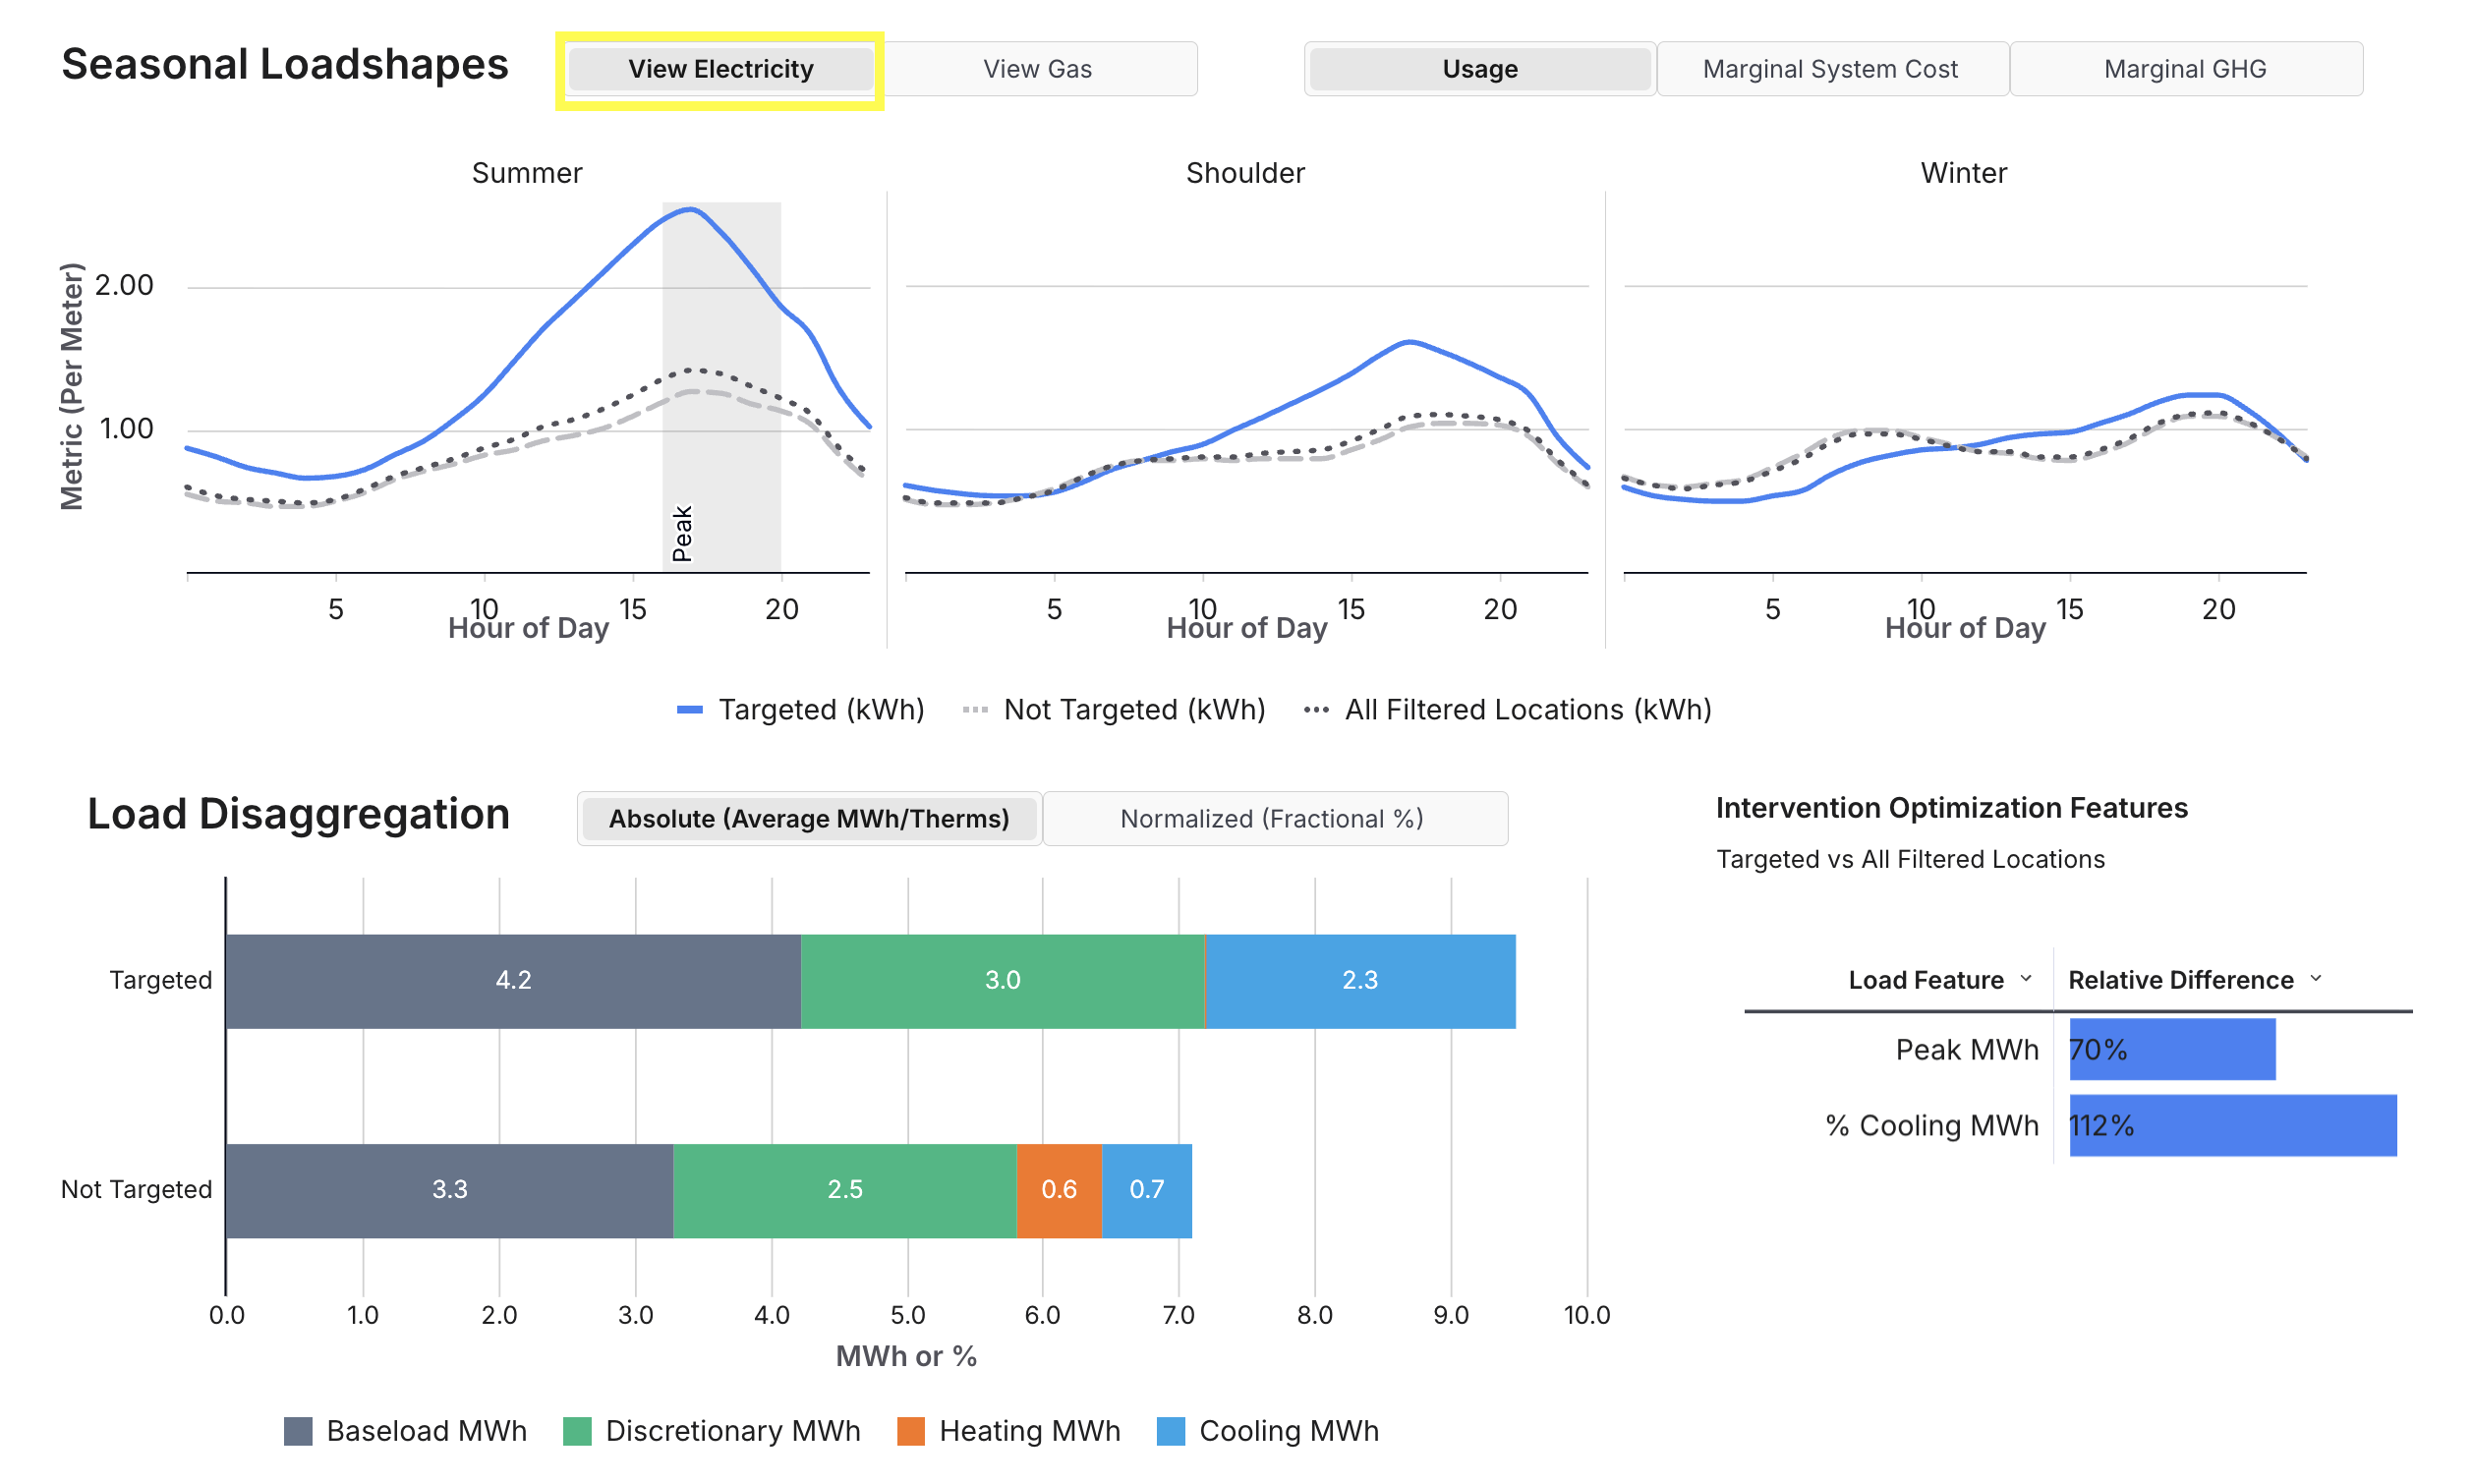
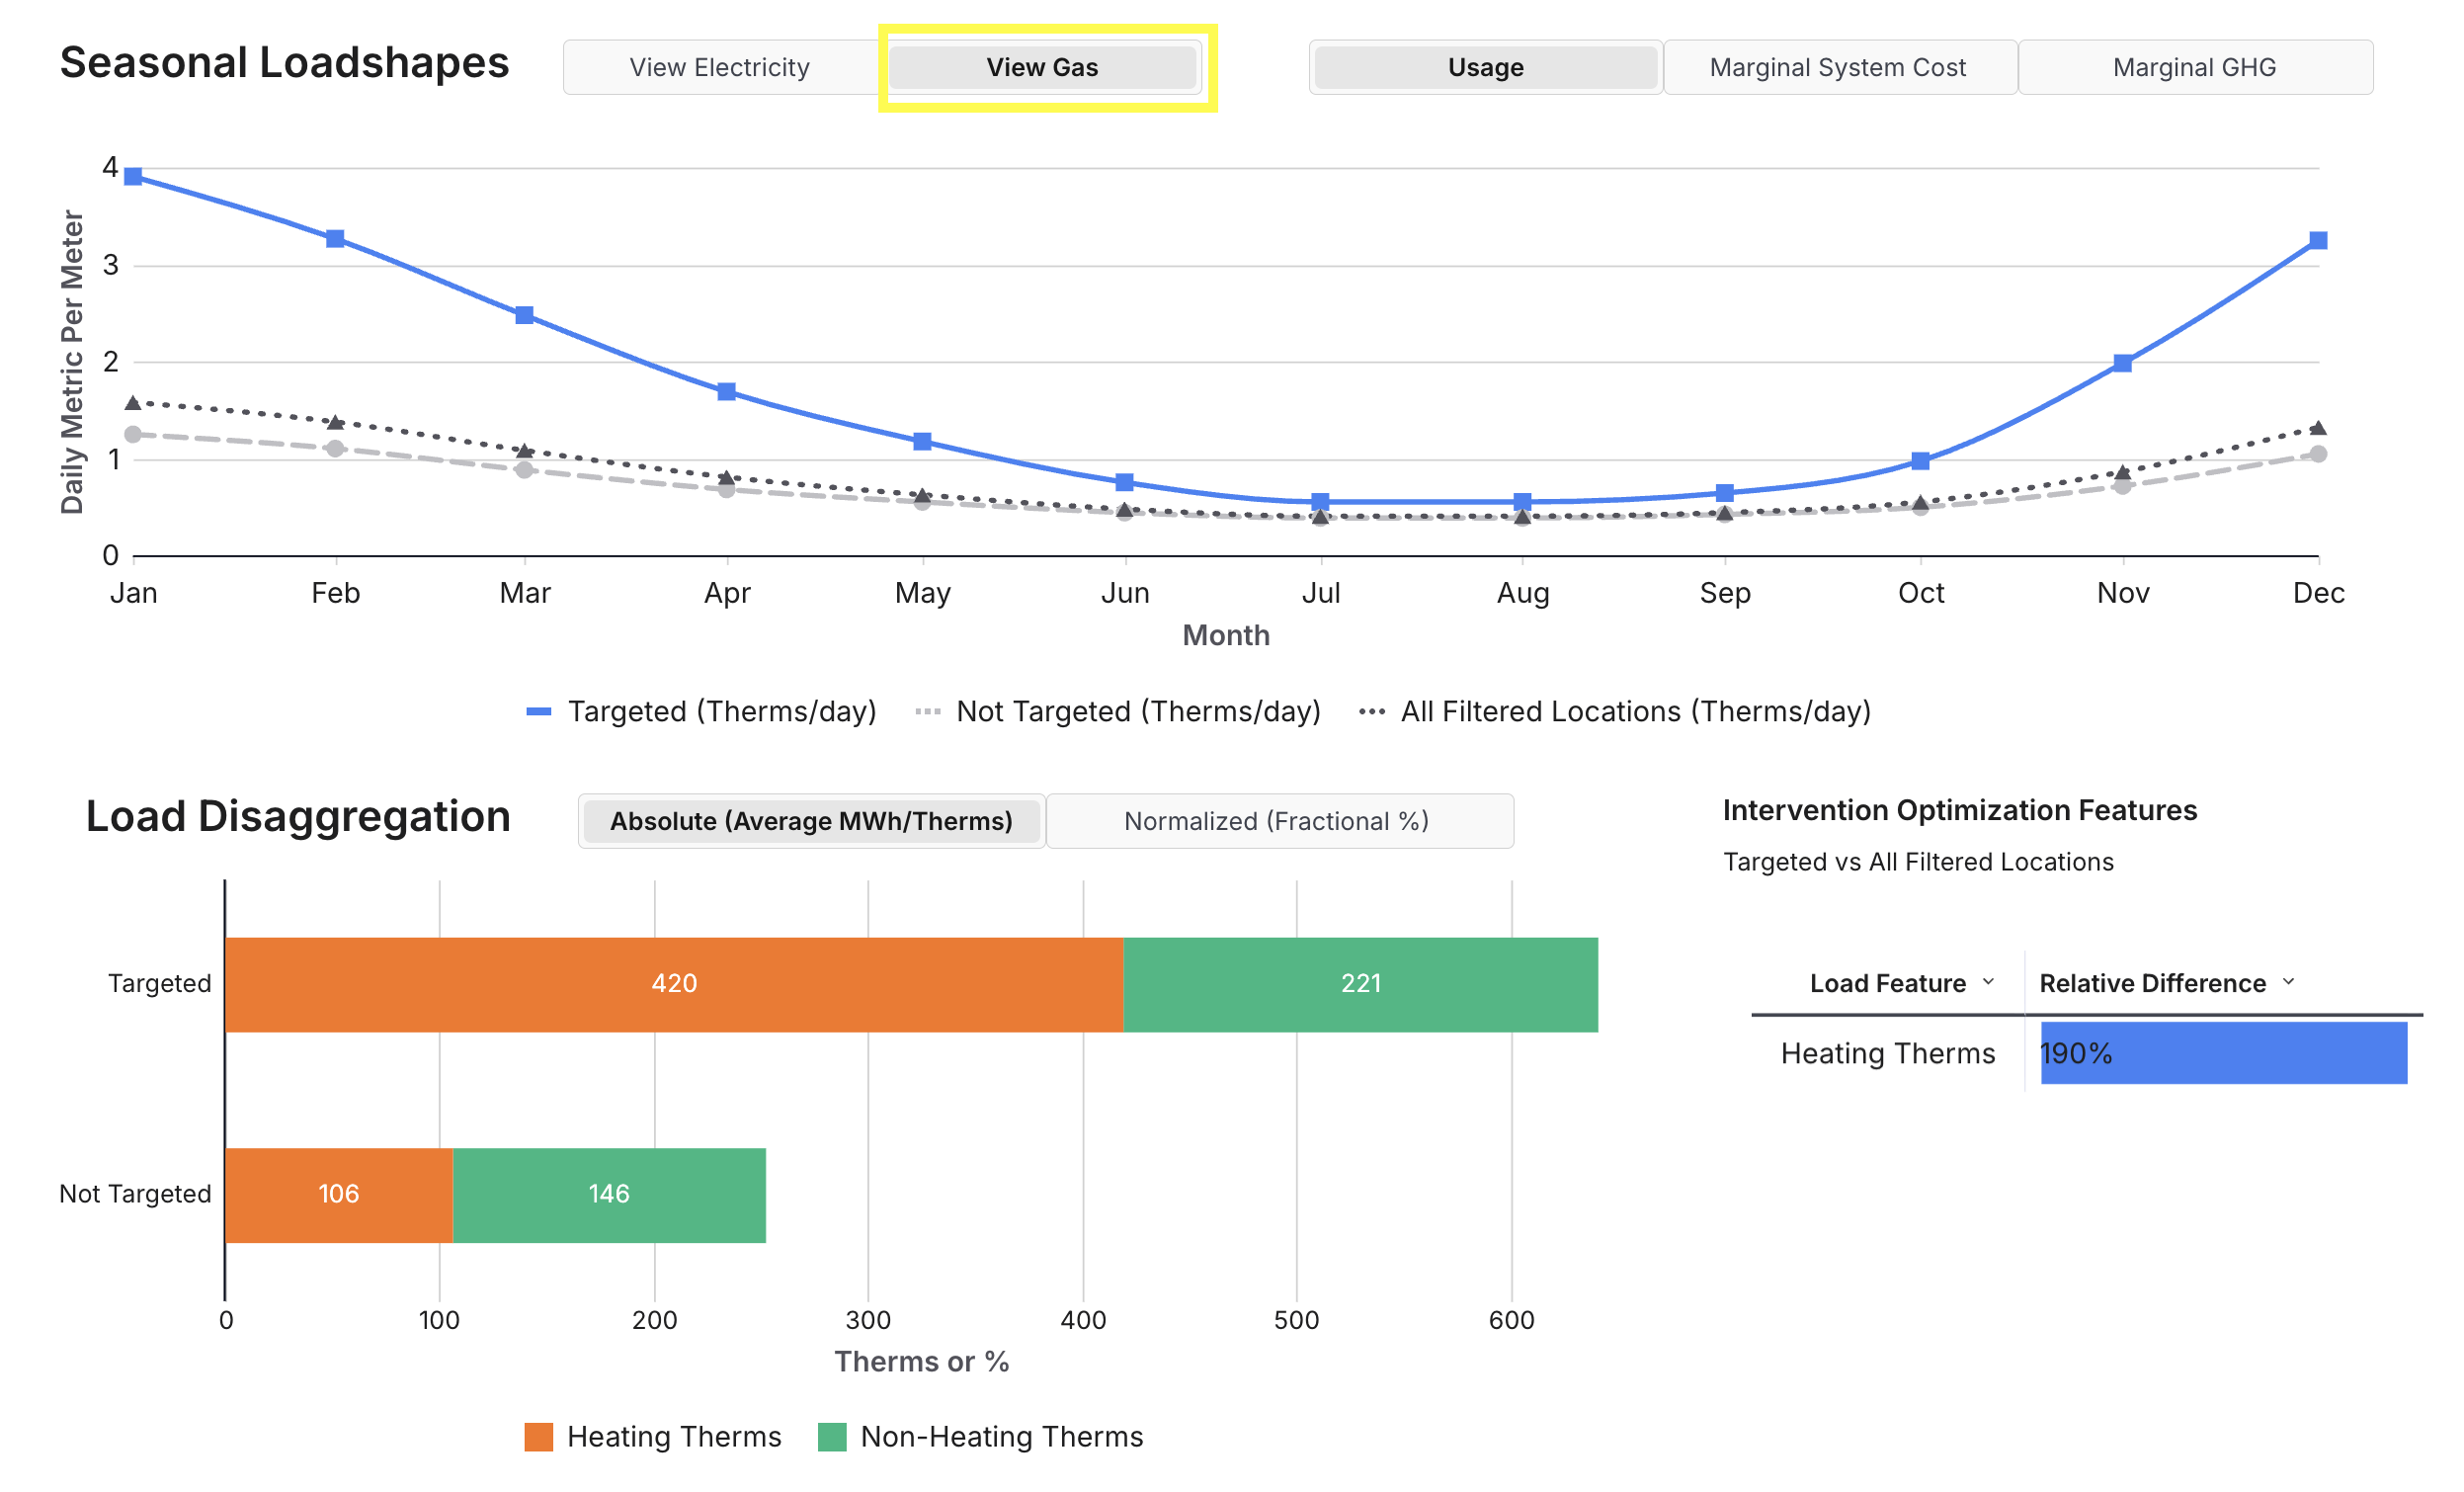
Within Impacts, users can explore the energy consumption patterns and load disaggregation for the targeted population and compare it with the non-targeted population. Seasonal average hourly load shapes are provided for electricity, and average daily load by month is shown for gas. These load shapes help users determine whether the target population is well-positioned to realize savings from the intervention under consideration. For example, the images below show a subsegment of residential customers that have been targeted for a smart thermostat Demand Response program (as shown in the image above) - in this case, the targeted population has a uniquely high summer peak load, and may generate significant value by reducing load in those hours.
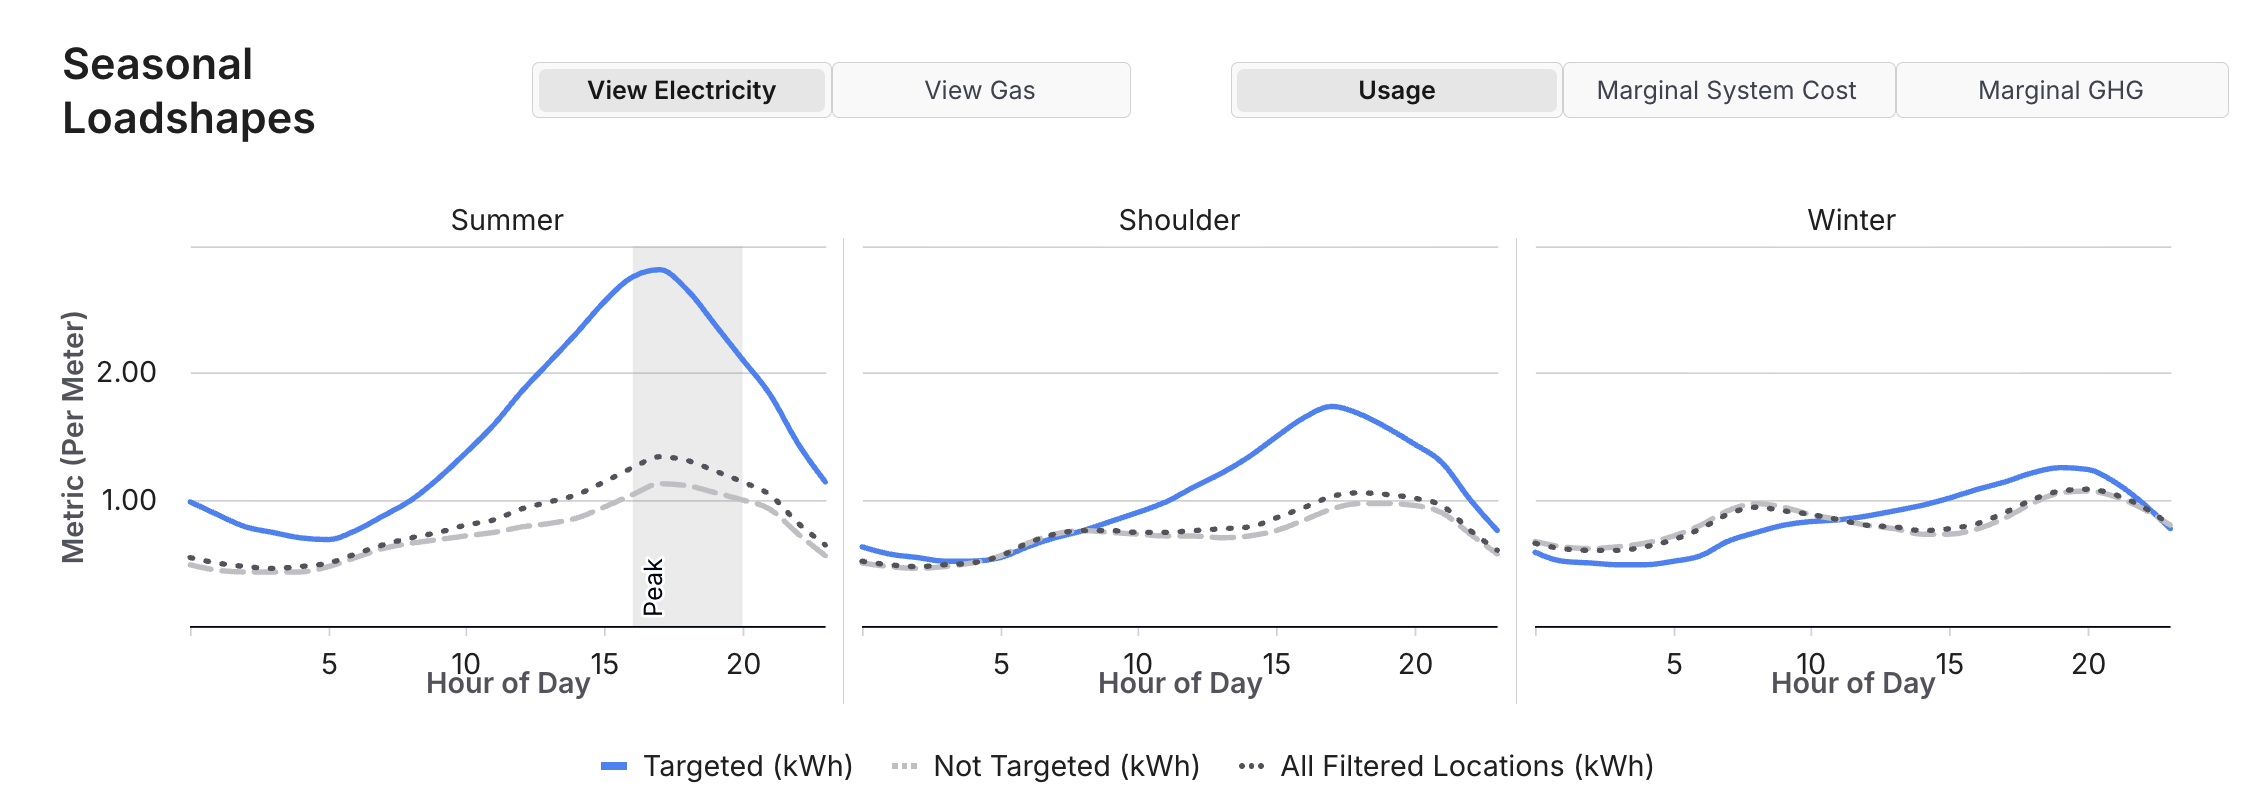
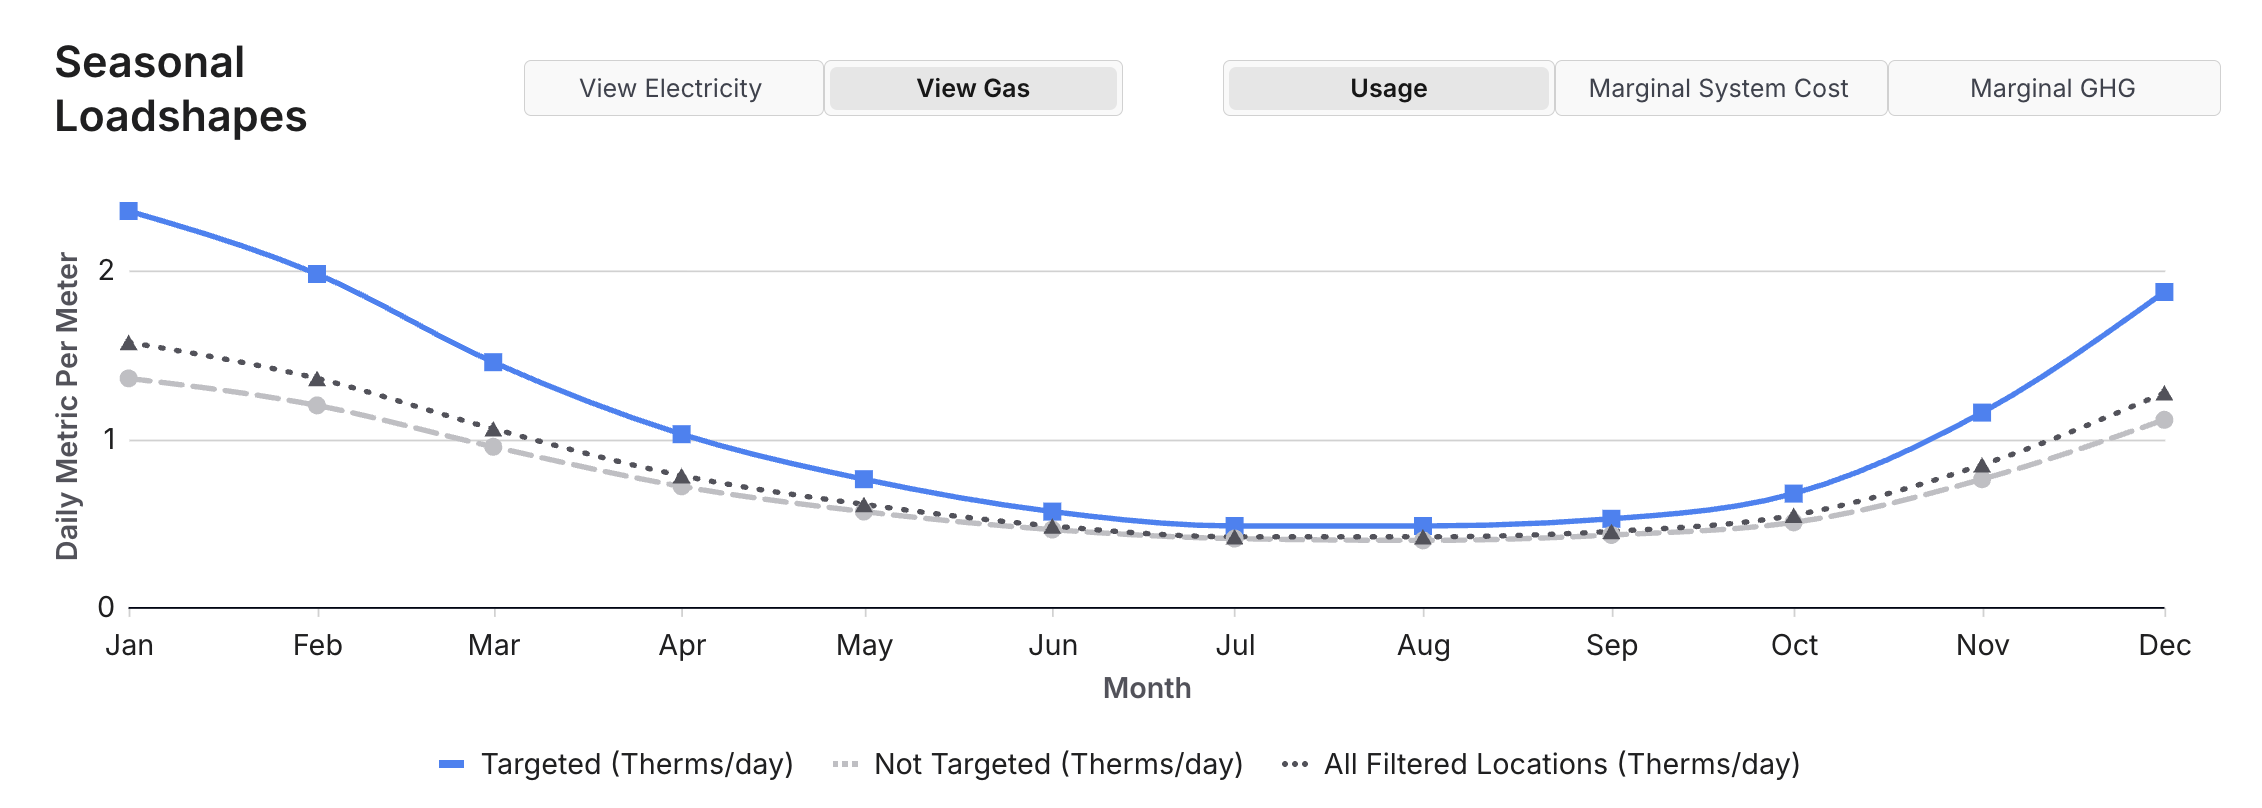
Examining the average electricity and gas load shapes (shown in Figure 3) indicates that in this case, the targeted population exhibits substantially different energy use patterns than the non-targeted population, especially for summer months.
-
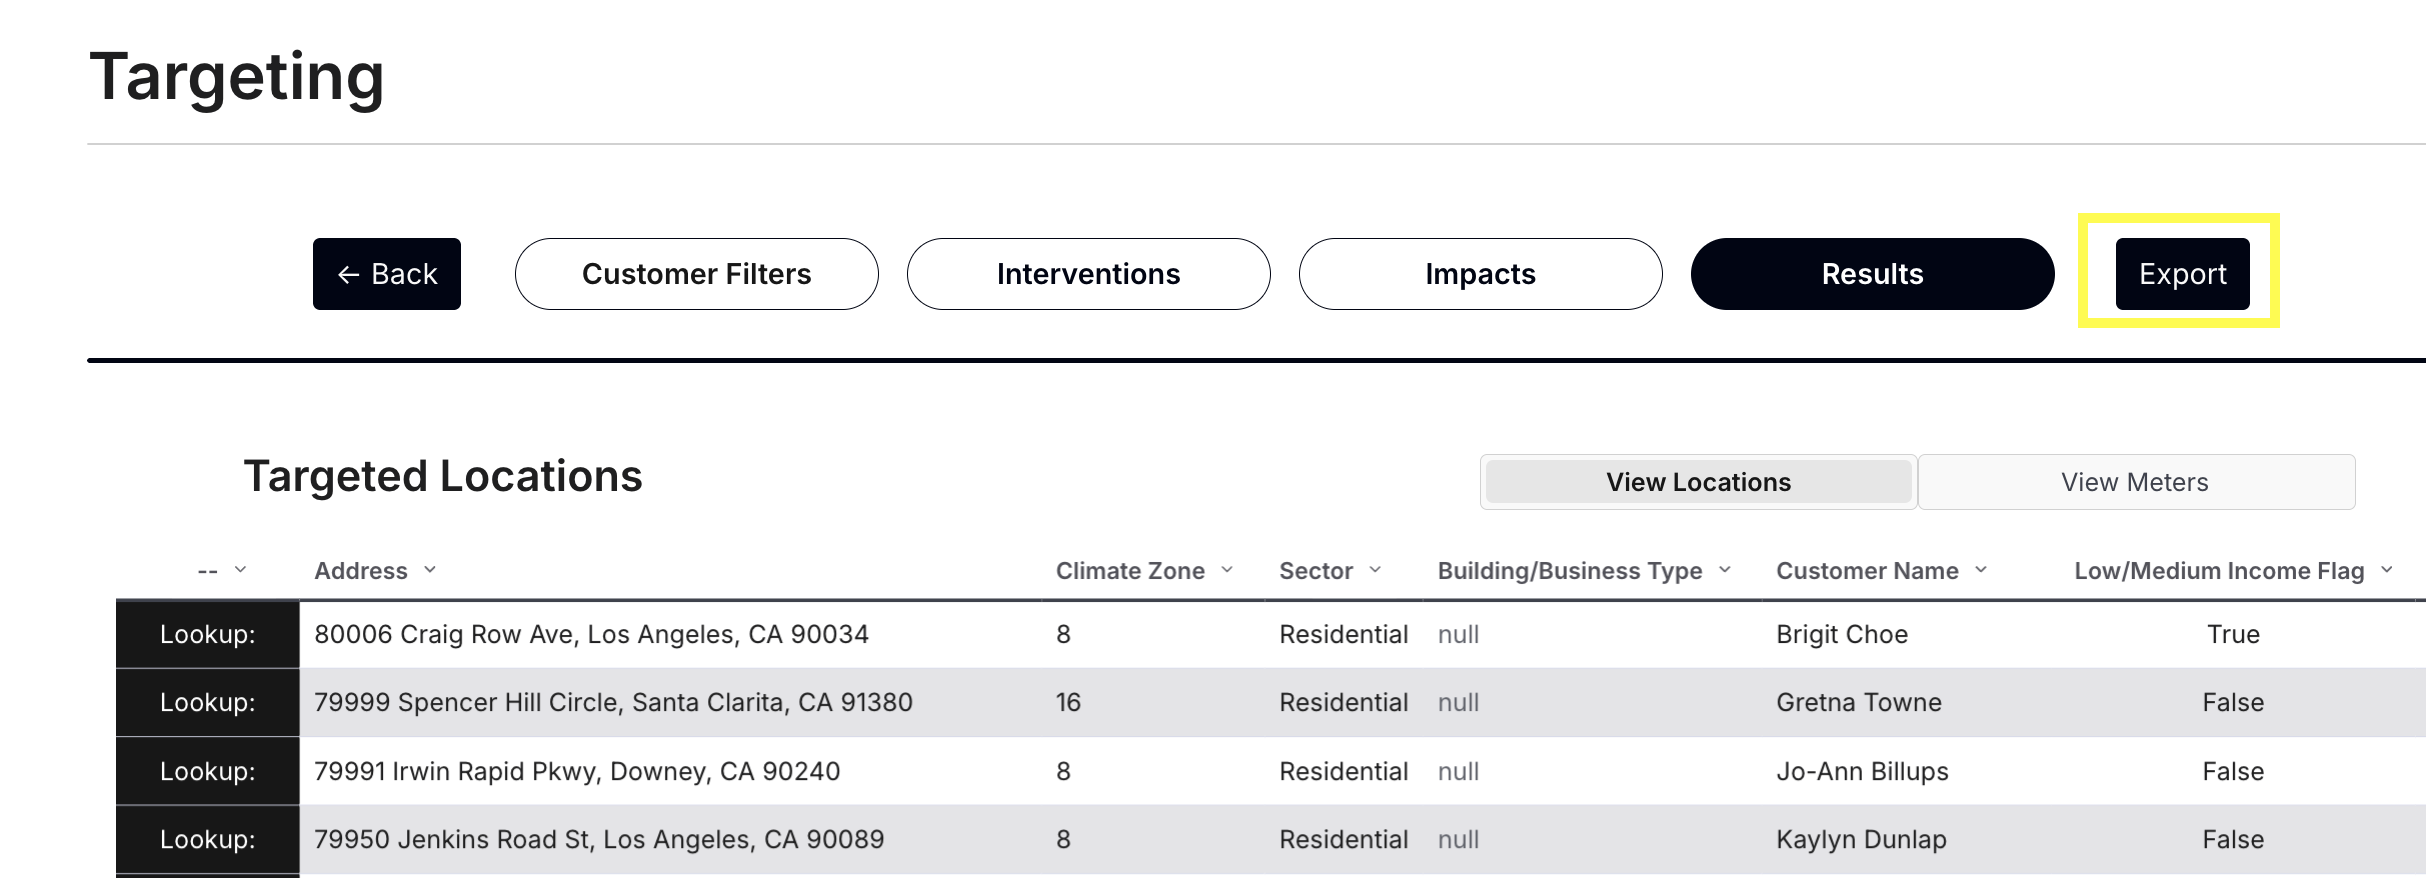
Export Results
Once users are satisfied that the Targeted population has the desired characteristics for the prospective program, users can view and export a location and/or meter-level table containing customer contact information, energy performance characteristics, and other metadata to facilitate marketing and outreach. Within the Targeted Locations or Targeted Results tables, users can select 'Lookup' to initiate a drilldown into a specific customer's attributes and load characteristics. Alternatively, the Customer Lookup function can be accessed directly via the Customer Filters page if desired.
Customer Lookup
The Customer Lookup tab allows users to explore energy, system costs, and emissions at individual meters. Users can filter down to an individual location based on:
- Address
- Customer Name
- Service Point ID
Users can also examine consumption, system costs, and emissions by season at the meter. This functionality may be valuable to users who want to spot-check high-consumption customers that have been targeted, or to investigate individual meters contributing to unusual load shapes for a given targeted population.
Example - Target Low-Income Customers for HVAC Electrification Program
This example illustrates how Targeting can be used to design a residential beneficial HVAC electrification program, tailored to low-income customers.
-
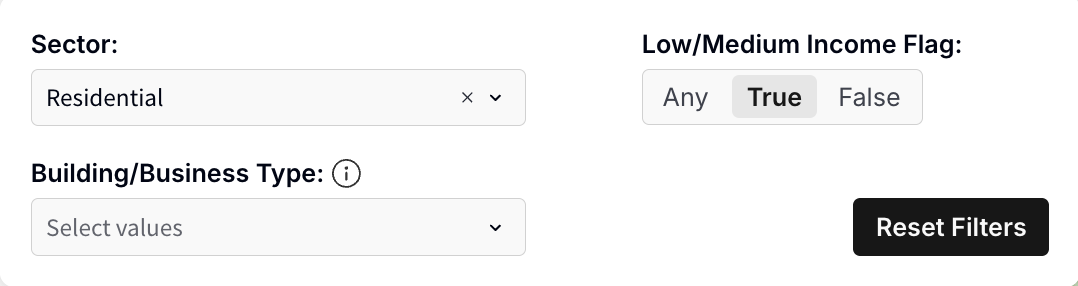
Select Customer Filters
To find customers for such a program, users can start by filtering the population using the Sector dropdown and Low/Medium Income Flag options available in the Customer Attribute Filters section, as shown in the image below.
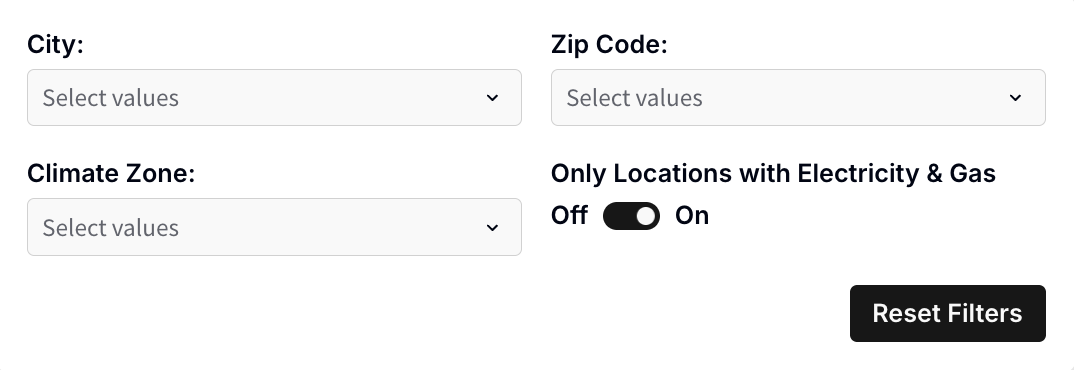
Recent work at Recurve indicates that customers with high pre-participation cooling loads tend to experience significant savings in the summer when replacing inefficient cooling equipment with high-efficiency heat pumps. Targeting allows users to filter for locations with electricity and gas meter data (see image below), to help identify customers with high cooling loads who are most likely to experience net savings from HVAC electrification1.
-
Select Intervention
Once the eligible population has been filtered, users can select the HVAC Electrification intervention option to filter for ideal program participants, based on:
- Heating Therms Usage - Top Quartile
- Summer Peak MWh Usage - Top Half
- Cooling/Annual (%) - Top Half
These filters are intended to isolate customers with large gas space heating loads (who may realize the most substantial emissions reductions) who are also the largest cooling consumers and will benefit from more efficient cooling equipment2.
-
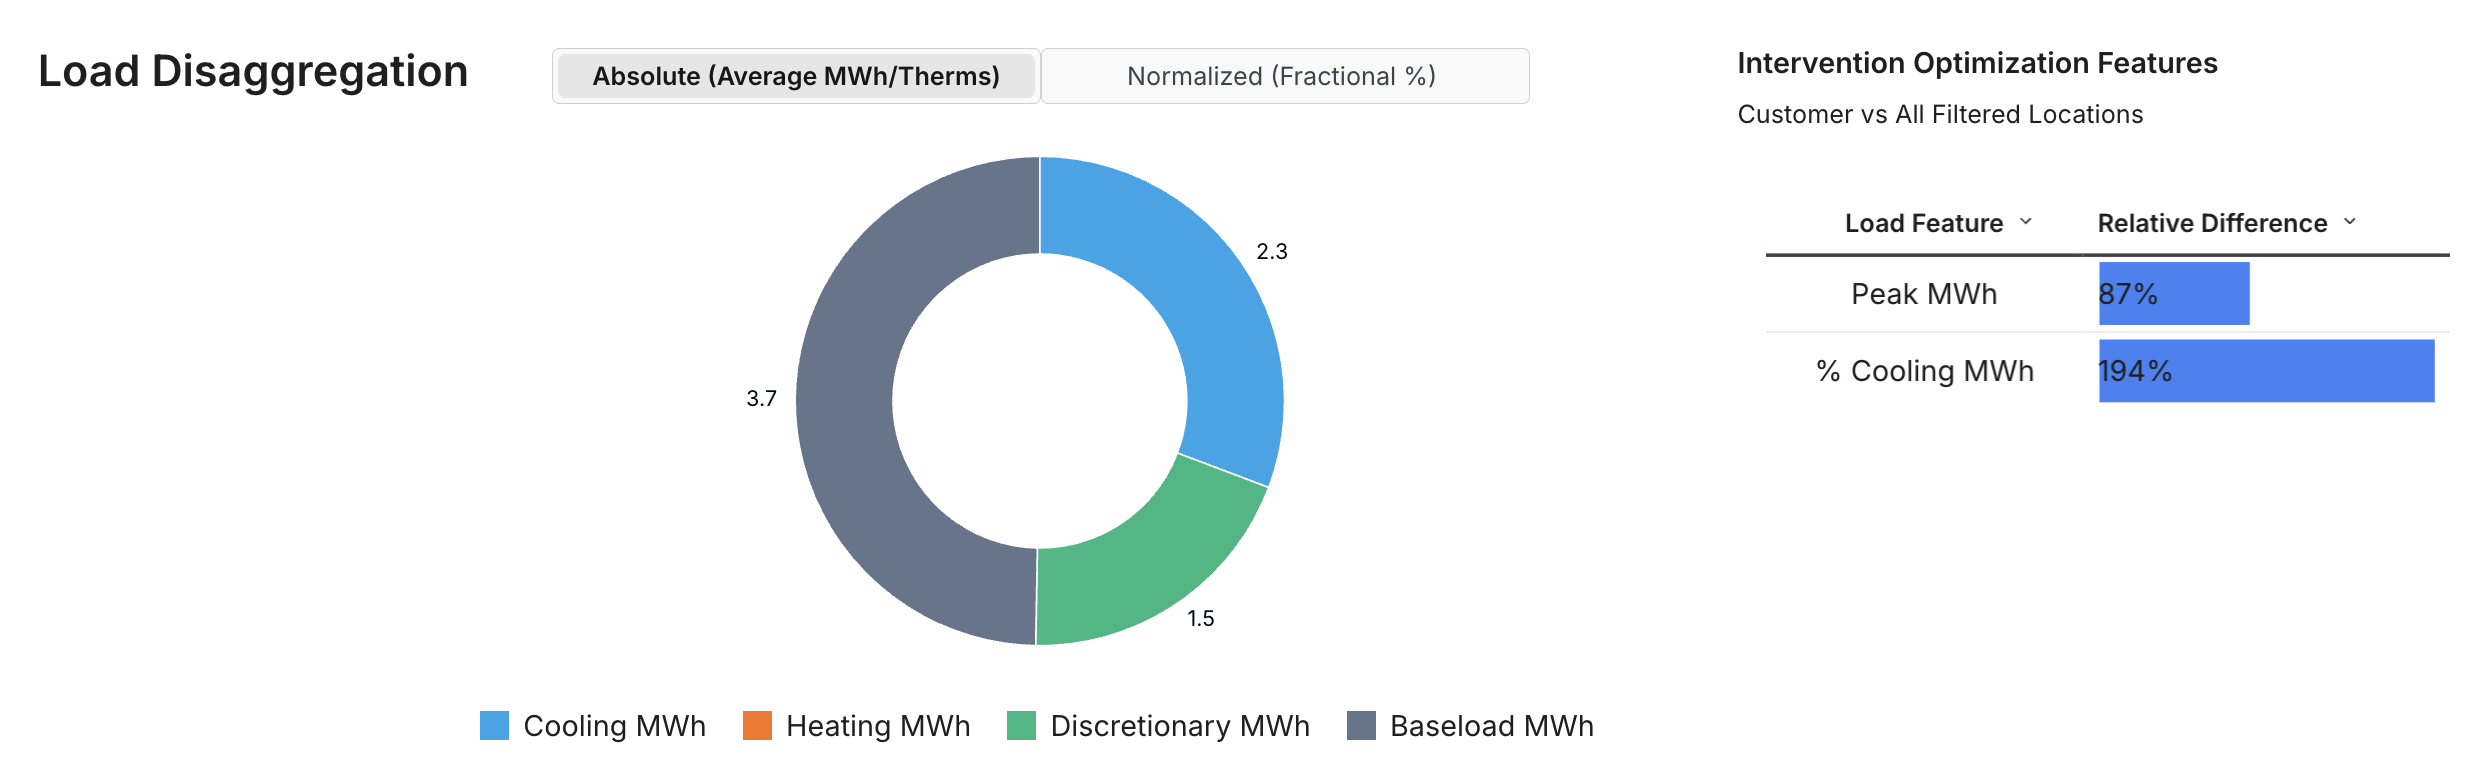
Review Outcomes
As shown in the images below, the targeted population has substantially higher summer cooling loads and winter gas heating loads than the non-targeted population. The Targeting Impacts indicate that Heating Therms Usage (Gas Feature 1) is substantially higher, possibly due to customers operating aging and inefficient gas heating equipment. Note that the targeted population has lower electric Heating MWh - this is likely a result of the user’s service territory having a significant number of customers with electric heating, who fall into the non-targeted population in this case. These Impacts show that the target population has substantially higher summer peak loads and winter gas heating loads, respectively.
If the program budget cannot support the number of customers identified by these Presets, users can narrow the cooling or heating Targeting ranges to further isolate the customers most likely to benefit from heating electrification. Once the Targeted population has been narrowed (or expanded) to the desired size, users can export the meter-level table containing customer contact information and other relevant data to facilitate marketing and outreach.
Additional Notes & Documentation
Please refer to the detailed technical documentation below for more information. If you have further questions or need additional assistance, please don’t hesitate to reach out to us at support@recurve.com:
Footnotes
-
Note that some customers may actually have both gas and electricity meters at their home, but data may only be available for one of the two meter types. If the Only Locations with Electric and Gas Meter(s) filter is applied, gas-only and electric-only locations would not be included in the targeted group ↩
-
Note that performance quartiles for each meter are defined based on the overall population of customers, rather than the targeted customers ↩